System Health
The System Health view provides information about the health status of the services included in your Resolve Insights installation.
The displayed information relates to the machines and services making up Insights. It is independent of the devices, services, and applications in the Insights inventory.
Access the System Health Page
The System Health page can be accessed in two ways:
- By clicking System Health in the Insights login screen.
Opening the page from the login screen doesn't require you to be logged in.
- By selecting Settings > System Health from the header.
System Health Overview
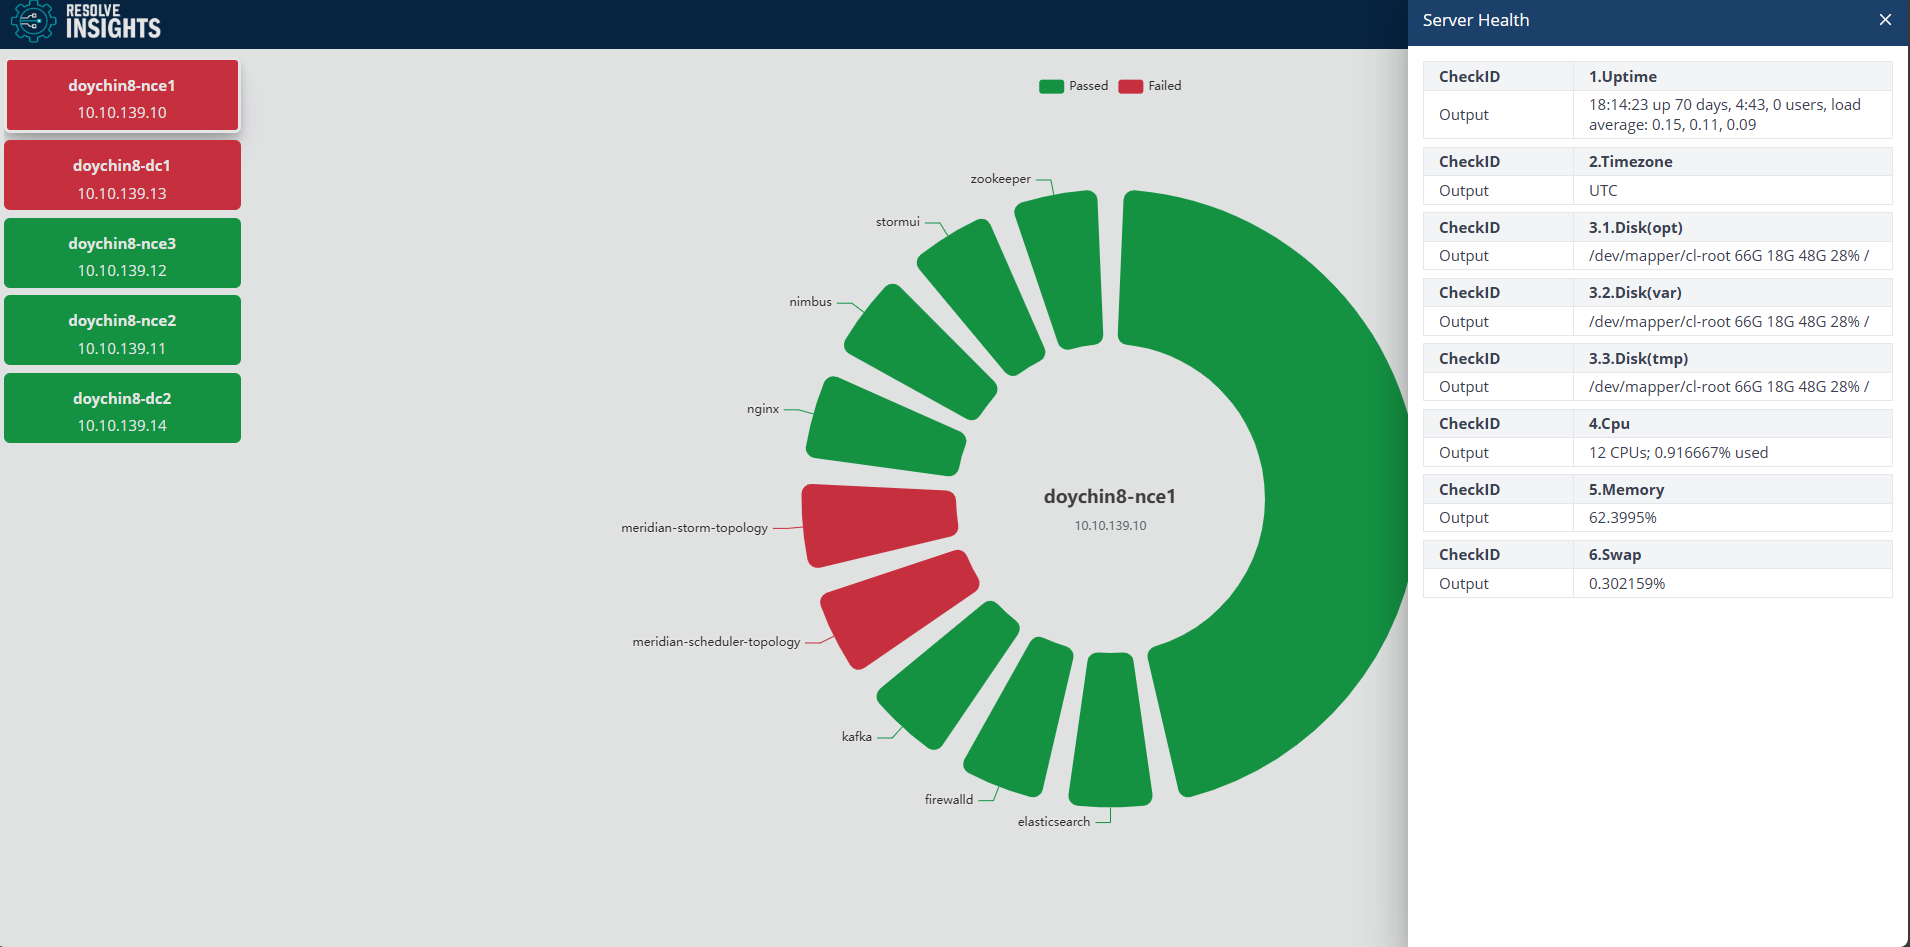
After you open the System Health page, you will see a list of the server's hostnames and IP addresses where Insights is installed and a diagram with details about the services used by the Insights application.
Depending on how you have configured the DC and the NCE clusters, you will see either a single or multiple nodes of each type. You can cross-check the node type by looking up the hostname in your installation configuration files.
You can select the different servers by clicking on the hostname card, and the diagram will load the Insights services installed on it with their current status.
You can click on each section of the diagram to dive deep into the detailed status of each service.
Configure System Health Criteria
The criteria that determine the status and the order in which the various services are displayed in the list are configured in a JSON file located under /opt/meridian/conf/health. Depending on the type of the node (NCE or DC), the file is named health_config_nce.json or health_config_dc.json.
Commonly, if even one of the services in the group has a status different from "passing", the Server Health of the entire group will be displayed with the same status to indicate a potential issue. However, you can always modify this configuration and add your own criteria that will define the system health appearance.